Posted At: Jul 08, 2024 - 589 Views

Developer Tool Console
Errors are an inevitable part of coding. As a developer, you'll frequently encounter them. However, users typically don’t see these errors in their browsers. To aid in identifying and fixing these issues, browsers include developer tools.
Importance of Developer Tools
- Error Detection: Reveals errors that are hidden from users.
- Debugging Assistance: Helps developers identify and resolve issues in the code.
- Script Insights: Provides valuable information about the scripts running on a webpage.
Preferred Browsers for Development
- Chrome and Firefox: Most developers prefer these browsers for their advanced developer tools.
- Other Browsers: Although they offer developer tools, they often lag behind Chrome and Firefox in terms of functionality.
Using Developer Tools
1: Accessing Developer Tools:
Google Chrome:
- Open a webpage, such as
bug.html. - Press
F12orCmd+Opt+J(on Mac) to access the developer tools.
- Firefox, Edge, and Others: Usually,
F12opens the developer tools.
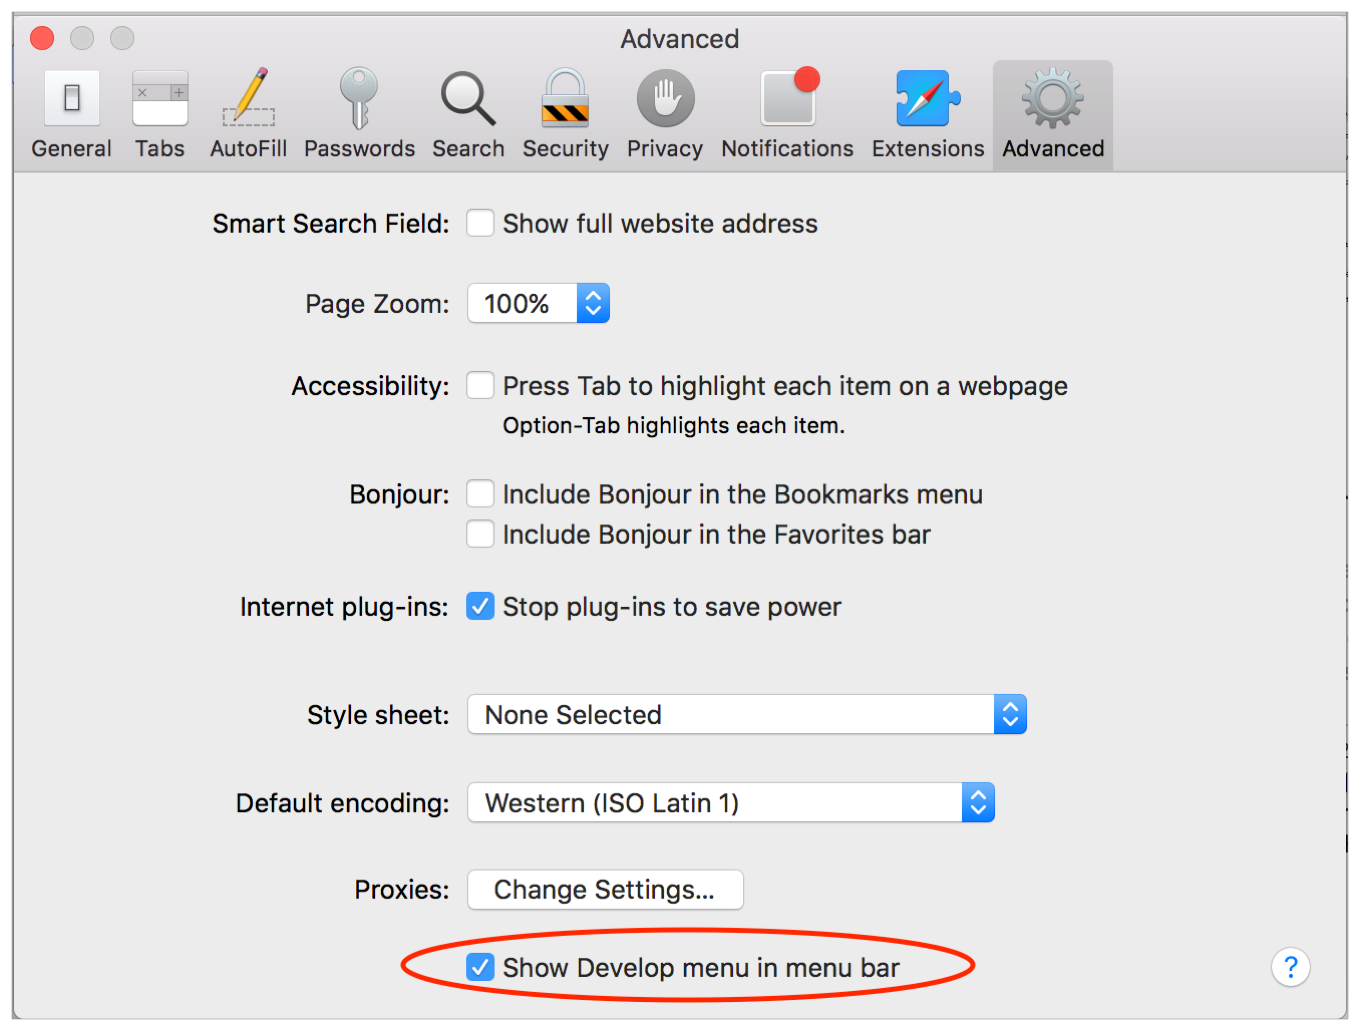
Safari:
- Enable the “Develop menu” by going to Preferences > Advanced and checking the appropriate box.
- Press
Cmd+Opt+Cto open the console.
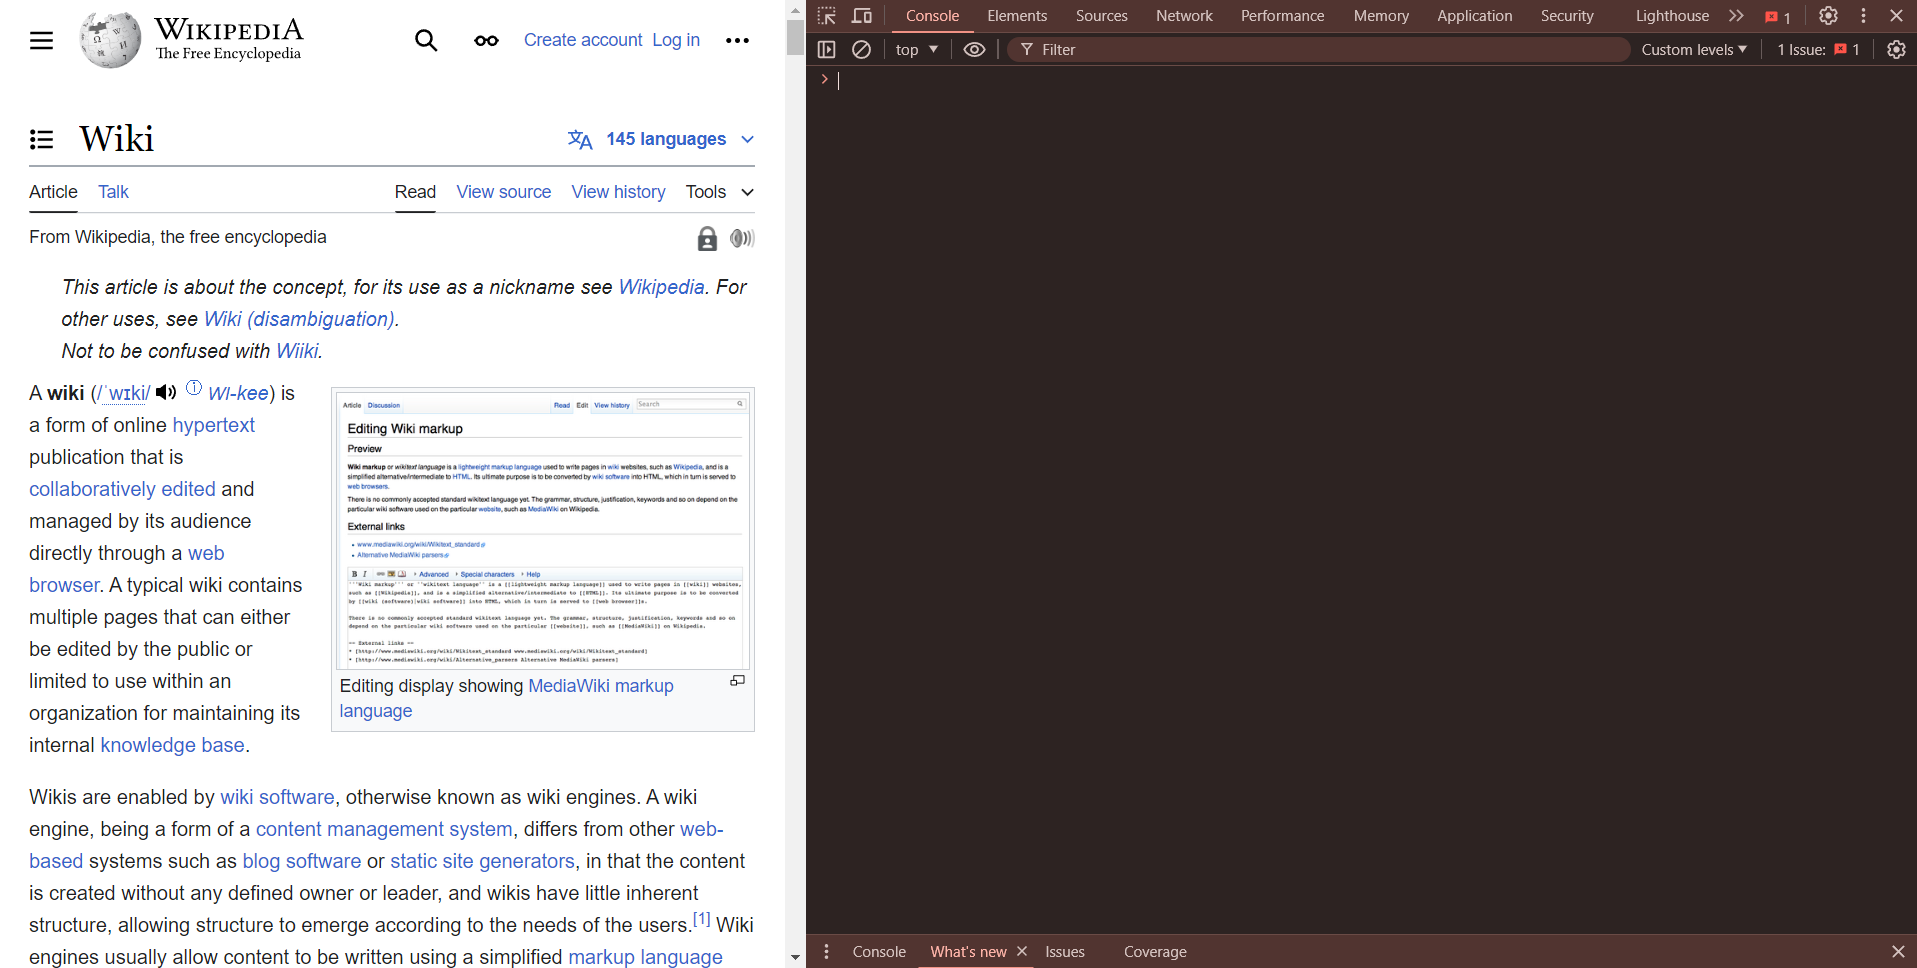
2: Viewing Errors:
- Errors appear in red within the Console tab.
- Errors include clickable links to the source code and line numbers where the error occurred.
- Example: An unknown command like
lalalawill show an error message.
3: Executing JavaScript Commands:
- A blue
>symbol marks the command line in the console. - Type JavaScript commands and press Enter to run them.
- For multi-line code input, press
Shift+Enter.
Multi-Line Input
- Pressing
Enterafter typing code in the console executes the code. - To enter multiple lines of code, use
Shift+Enter.
Browser-Specific Instructions
1: Google Chrome:
- Open developer tools with
F12orCmd+Opt+J(on Mac). - Errors and the command line are visible in the Console tab.
2: Firefox, Edge, and Others:
- Open developer tools with
F12. - The interface and functionality are similar to Chrome.
3: Safari
- Enable the Develop menu through Preferences.
- Use
Cmd+Opt+Cto access the console.
Summary
- Developer Tools: Essential for viewing errors, running commands, and examining variables.
- Opening Tools for Window:
F12for most browsers. - Opening Tools for Mac:
Cmd+Opt+Jfor Chrome,Cmd+Opt+Cfor Safari (after enabling the Develop menu). - Next Steps: With the environment set up, proceed to explore JavaScript further in the next section.
Next → JavaScript Fundamentals
Call to Action
How do you think AI will shape the future of technology? Share your thoughts in the comments below. For more insights into the latest tech trends, visit our website PlambIndia and stay updated with our blog.
Follow Us
Stay updated with our latest projects and insights by following us on social media:
- LinkedIn: PlambIndia Software Solutions
- PlambIndia: Plambindia Software Solution.
- WhatsApp Number: +91 87663 78125
- Email: contact@plambIndia.com , kuldeeptrivedi456@gmail.com
Become a Client
Explore our diverse range of services and find the perfect solution tailored to your needs. Select a category below to learn more about how we can help transform your business.
Kuldeep Trivedi
plot no 1 / 2 suraj mall compound mal compound
+918766378125
contact@plambindia.com